


Steel plant board: eight sites in a table and on a map, open alarms below
This is the Sites page of a steel plant board on our demo workspace. Eight plants, one row each.
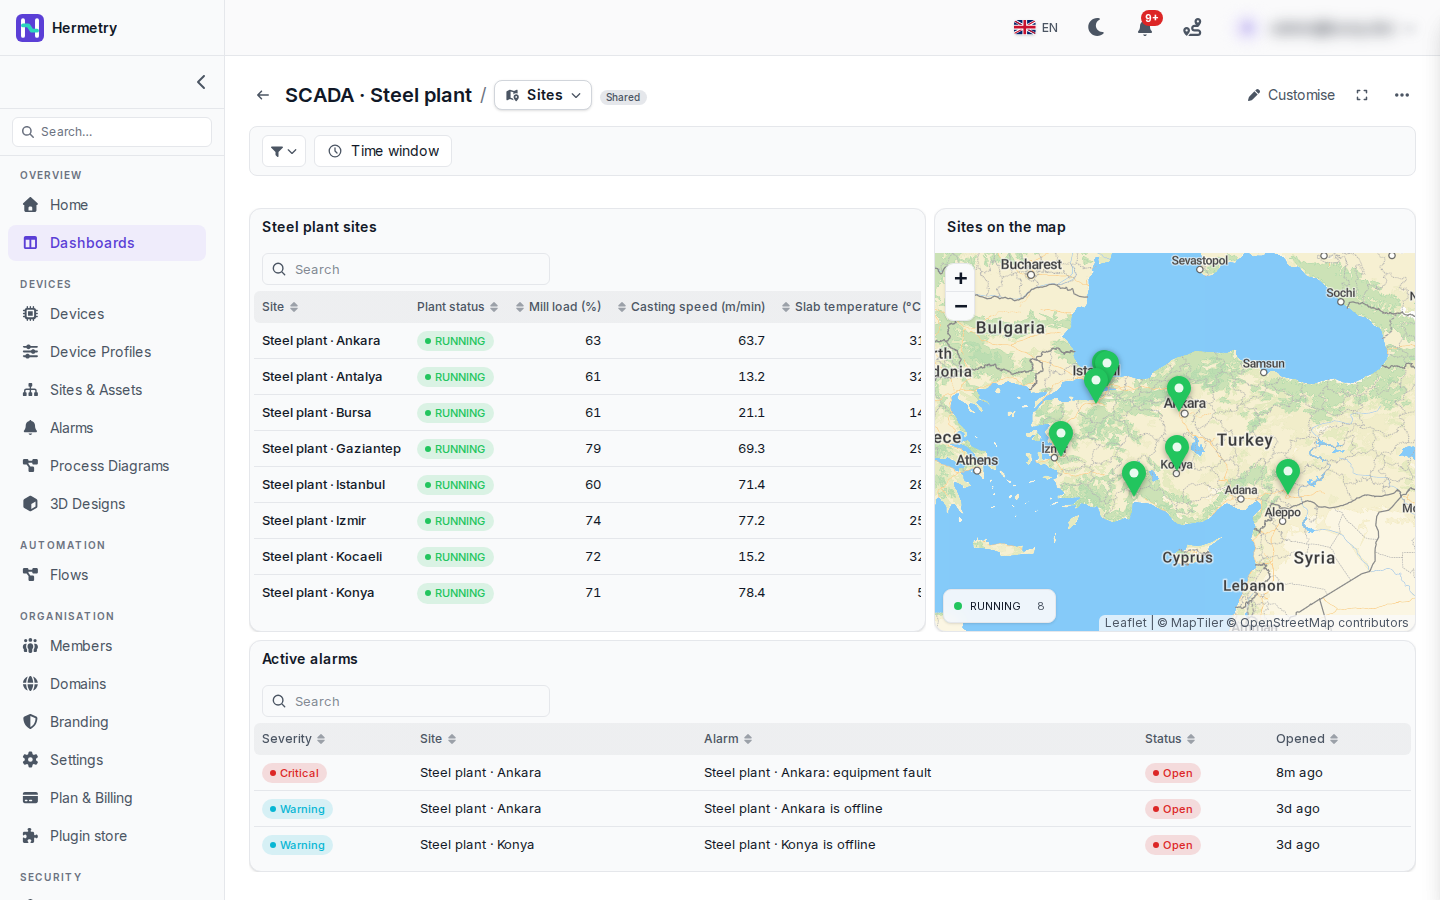
Top left is a table with the site, a Plant status badge and three values per site: mill load in %, casting speed in m/min and slab temperature in °C. Next to it the same eight sites on a map, with the legend counting them by status (RUNNING 8). Under both is an Active alarms table with severity, site, alarm text, status and when it opened. When I took this, Ankara had a Critical equipment fault from eight minutes earlier, and Ankara and Konya each had an offline warning from three days before.
One thing I’d change: the table is wider than its card, so the temperature column runs off the right edge. I’ll narrow the Site column or drop one value.
The numbers on this board are demo values, not readings from a real plant. A real slab caster runs at a few metres a minute at most, so don’t take the casting speeds as a reference.
Ankara says RUNNING in the table but also has an “is offline” alarm open for 3 days. If I’m the operator, which one do I believe?
The alarm. RUNNING is the last plant status value the board has for Ankara, and a latest value stays until the next one arrives. An offline alarm clears by itself when the device connects or sends something again, so while it is open, nothing new has come since it opened three days ago. That is a weakness of this board as it stands.
A row click that sets the board’s site parameter, with the alarm table following that parameter, would put the two side by side. On this board the alarm table shows everything.
How did you get the green badges in the status column? Mine shows plain text.
It is the column’s Cell setting, in the table card’s Columns. With Cell on Auto, a column shows as a badge when it is a badge column or when it has Value colours. If yours shows plain text, add a row under Value colours for RUNNING with a green colour. Badge style is Tinted, Dot or Solid.
Two of your markers near the top are almost on top of each other. Do they group when they overlap?
Only if you ask for it. Group nearby markers is off by default; turned on, overlapping markers become one bubble with a count and a click zooms in. I left it off here because eight markers stay readable.
- You must be logged in to reply to this topic.
Join the conversation
Sign in to ask and answer, like helpful posts and mark the reply that solved your problem. Every contribution earns points and levels.