


Dashboards
One board design for every site
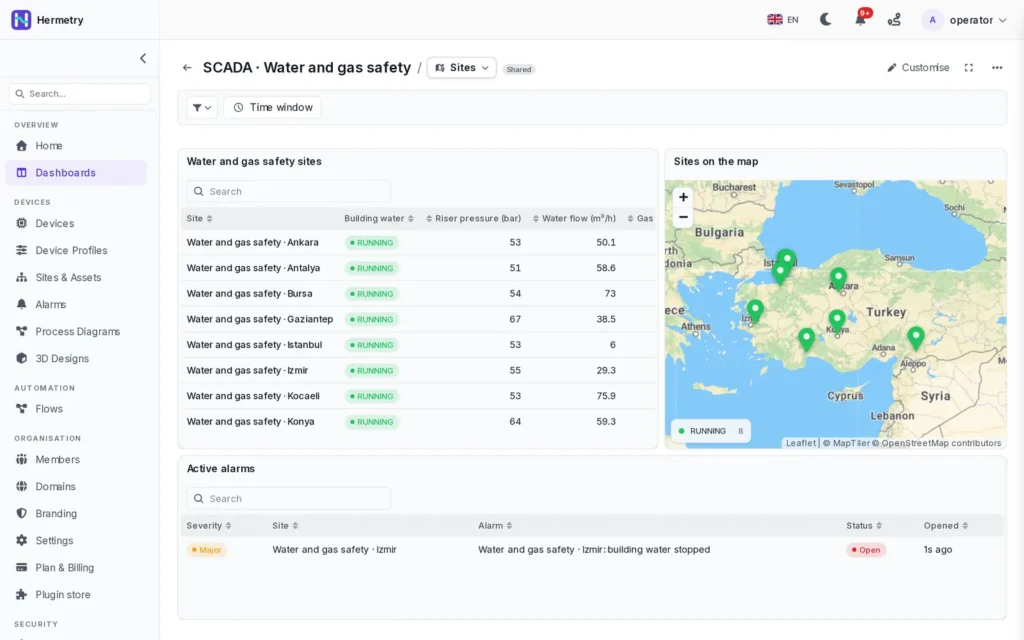
A dashboard is a board of cards bound to live device data. Parameters let one board serve every site, drill-down opens the page of the site you clicked, and SCADA drawings and 3D views sit on the same board as charts and tables.
Widgets
The built-in widgets
Modules add their own, and administrators can publish widgets for the whole organisation.
Charts
Line, bar, area, pie and donut, scatter, histogram and heatmap. Several series per chart, each with its own label, colour, unit and decimals.
Data cards
Stat, stat with trend, attributes, progress, state, gauge, table, activity feed and map. A gauge takes its scale from the range set in the device profile.
IoT cards
Device tables with the live connection state, alarm tables and counts, and the Rules card that lists the rules of a place.
Controls
Buttons and other controls that send commands, always behind a confirmation. Controls on a board send basic-tier commands only.
SCADA and 3D
Process drawings whose symbols move with live values, and 3D views whose rooms take the colour of the worst status in them.
Content
Text and Markdown, images, quick links, and embedded pages from the sites your administrator allows.
Many sites, one design
Parameters and drill-down
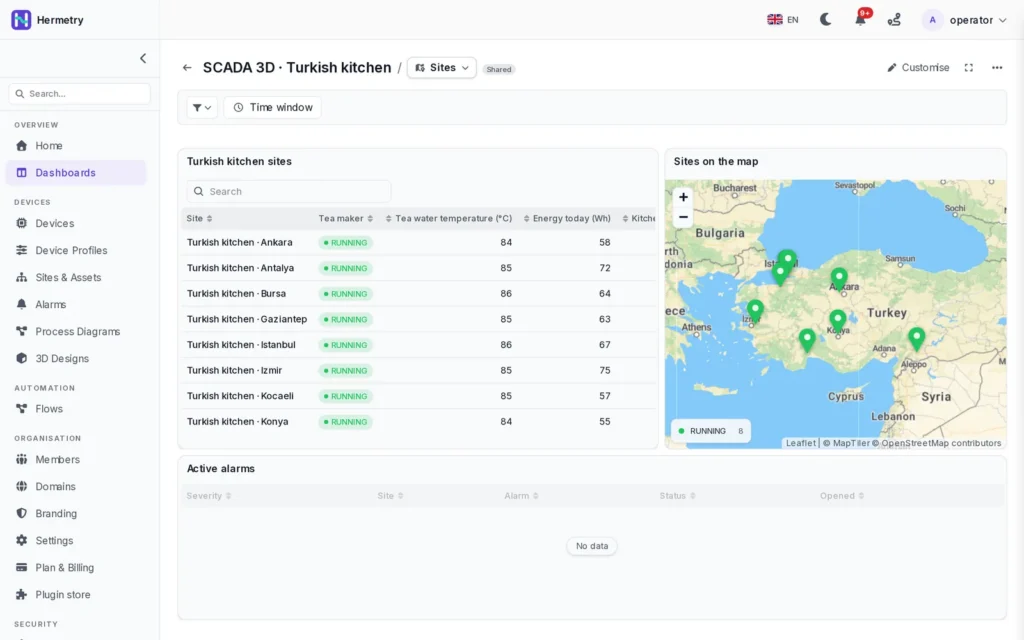
An entity parameter picks a site or a device, and every card on the board follows it. Pick a site in the filter bar, or click a row in the sites table, and the board opens that site's page with the way back shown as a breadcrumb.
- Up to 16 parameters in the filter bar
- Key filters, such as temperature above 30, narrow a set of devices
- The view is kept in the address, so a link opens the same view
- The Sites template: a table and map of your sites, then a page per site
Personal and shared
A home board for each person
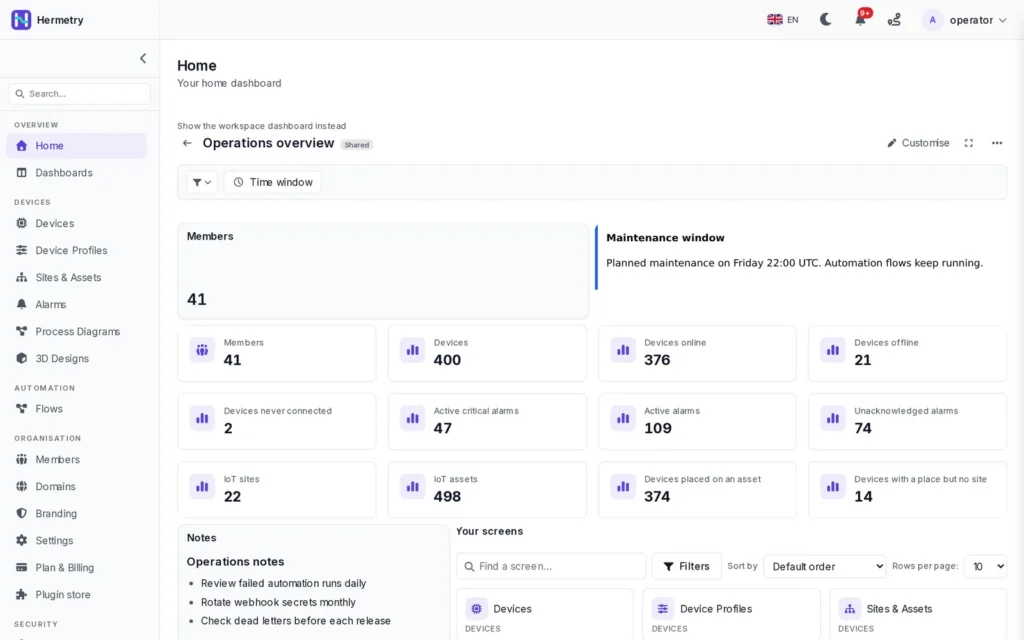
Any board can be your landing page. Personal boards are yours alone; shared boards are made by administrators and show each viewer only the data that viewer may read.
- Full screen without the menus, or one card enlarged
- Time window per board, changeable by the viewer
- Up to 20 pages per board, opened in place, in a side panel, a dialog or a popover
- A card that fails to load keeps its place; the rest of the board still works
History
How far back your charts go
Your plan sets one retention class for the organisation. Raw readings are kept for at most 90 days; summaries keep the long history.
| Retention class | Raw readings | 1-minute summaries | Hourly and daily summaries |
|---|---|---|---|
| 7 days | 7 days | 7 days | 7 days |
| 30 days | 7 days | 30 days | 30 days |
| 90 days | 30 days | 31 days | 90 days |
| 365 days | 90 days | 31 days | 365 days |
| 1,095 days | 90 days | 31 days | 1,095 days |
Sharing, SCADA and limits
Putting boards in front of people
Display links for wall screens
A display link shows a shared board on a screen where nobody signs in, such as a control room wall. See sharing dashboards, and pumping stations for a board built this way.
- Valid for 1 to 365 days, and revocable one link at a time
- Read-only: controls are inactive and nothing can be changed from the screen
- Acts as the member who created it, never with more rights than that member has now
- Cards refresh on their interval; the token sits in the part of the address that is never sent to servers
SCADA drawings and 3D views on a board
A drawing is attached as a view of a device, a site or a profile, so one drawing serves many sites while each keeps its own connections. A 2D drawing can be turned into a 3D view, and both can sit on the same board as charts. See SCADA.
Export
A card's data downloads as CSV or a spreadsheet file. A whole board exports to a file and imports into another organisation after a dry run that lists what must be repaired or skipped.
Limits worth knowing
- A resolved entity set holds at most 500 entities, a fixed list at most 100
- 16 filters per board, 8 key filters per filter, 4 conditions per key filter
- A SCADA drawing holds up to 200 symbols, 300 connections and 100 shapes
- Raw values can be read for windows of up to 24 hours; longer windows use the summaries
Scheduled or e-mailed reports are not available today. Analytics in Hermetry Insight are in development.
FAQ
Questions about dashboards
Do boards update live?
Cards that support it update live over one connection per board. Other cards, and tables with paging, refresh on their interval. Boards opened through a display link always refresh on the interval.
Can a dashboard control equipment?
Yes, from controls and from SCADA symbols that carry a command, always after a confirmation. A card click never runs a command, and controls on a board send basic-tier commands only.
Can different people see different data on the same board?
Yes. A shared board acts on each viewer's own permissions, so a viewer never sees data they may not read. Customers usually get an organisation of their own; see multi-tenancy.
Can we make our own widgets?
Administrators can create widgets for the organisation, with draft, published and archived states and a version history; members can make private ones. A card can also carry a small script that reshapes its data in a sandbox in the browser.
Can I get a report by e-mail every morning?
Not today: scheduled reports are not built. Download a card's data as CSV or a spreadsheet file, or read series through the REST API.
Want to see your sites on one board?
Book a demo and we build a first board with you, from your own device data.