


A small water network in the process-diagram editor, boreholes to water tower
I have been drawing sample screens for our demo workspace since 2.0. The water network is the one people ask about most, so here it is in the editor.
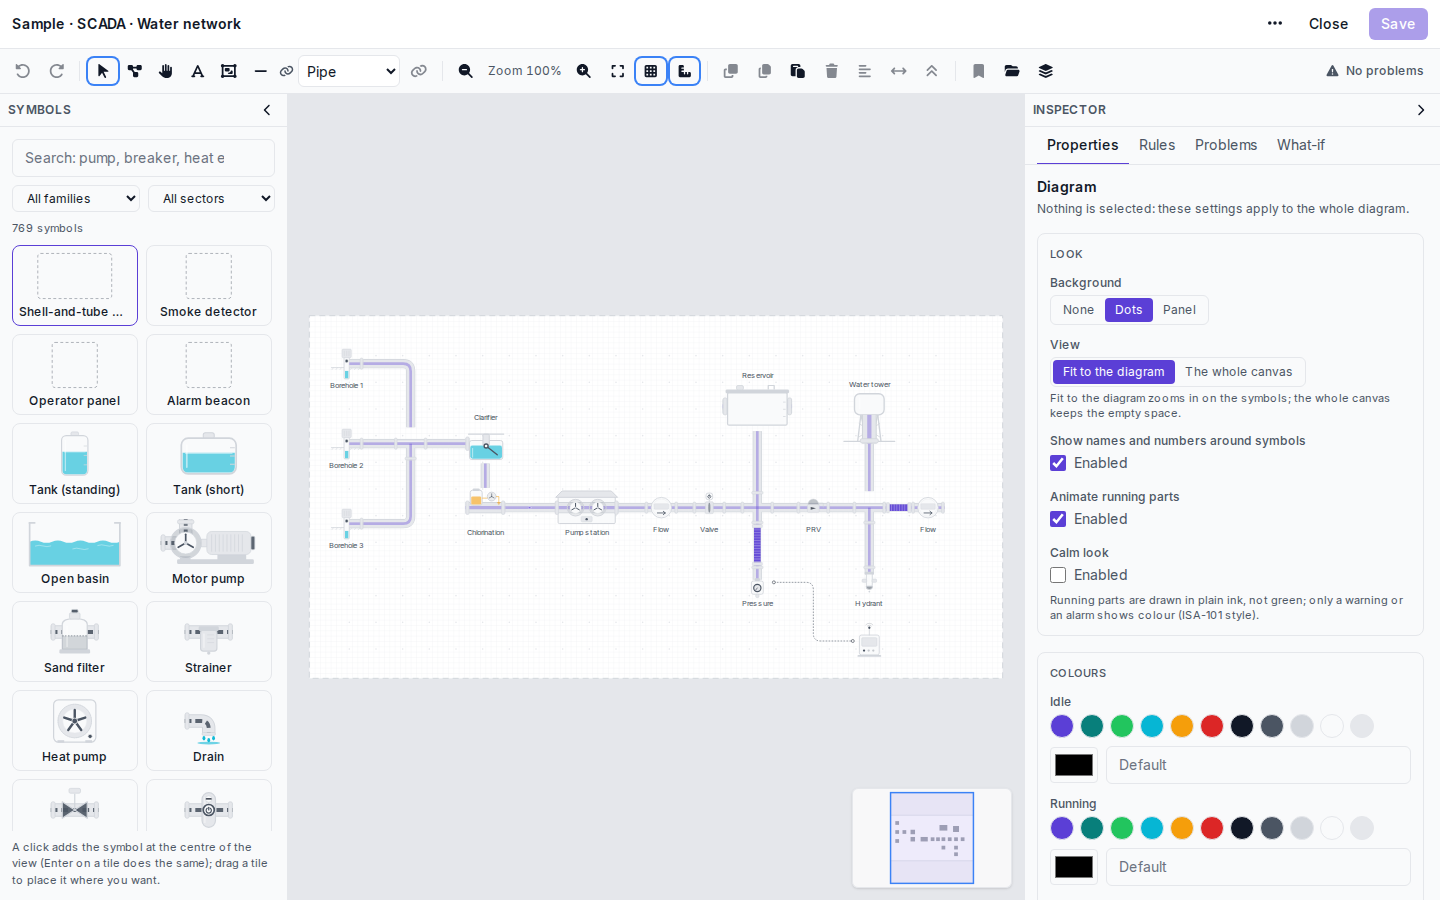
Left to right: three boreholes feed a clarifier, then chlorination and the pump station. After the station come a flow meter, a valve, the branch up to the reservoir, a pressure-reducing valve, the branch to the water tower and a second flow meter at the end. The pressure point and the hydrant hang below the main line, and the dotted line runs from the pressure point to a small cabinet.
Everything here is from the core set (borehole, clarifier, chlorinator, pump station, PRV, hydrant and water tower are all in the Water network family), so the drawing opens in any workspace that has the SCADA module.
With nothing selected, the inspector on the right shows the settings for the whole drawing. I keep the dots background and Fit to the diagram, so a card zooms in on the symbols and not on empty canvas. Calm look is off because this is a demo and people like colour. On a real control room screen I would turn it on. The toolbar says No problems; when it does not, the Problems tab tells you what is wrong, for example a connection that ends on a symbol that is no longer on the canvas.
The drawing itself holds no device data. The symbols get their values on the device’s or site’s Views after saving: Binding symbols to live data.
This is close to what we have, two boreholes and six pump stations that all look the same. Do I need six drawings?
One is enough. Each device keeps its own connections. If the six stations share a device profile, open the profile, choose Views in its header and bind the drawing to all of its devices in one go. One catch: nothing is stored on the profile itself, so a seventh station added later needs the run again or a view attached by hand. One drawing for many places
Student question: why is the PRV after the reservoir branch and not right after the pump station?
In this sample the reservoir branch takes off before the PRV, so the reservoir gets the pumps’ pressure. The PRV lowers the pressure for everything after it, which in the drawing includes the tower branch and the hydrant. But it is a demo layout I drew to show the symbols, not a hydraulic design, so please do not take it as how a network should be built.
Fair enough, thanks for answering!
Is the flow arrow on the pipes set per pipe or for the whole drawing?
Per connection. Select the pipe and tick Flow arrow in the inspector. It is off by default.
Calm look was the first thing I switched on for our network screen. The duty operators said the old overview looked like a Christmas tree.
- You must be logged in to reply to this topic.
Join the conversation
Sign in to ask and answer, like helpful posts and mark the reply that solved your problem. Every contribution earns points and levels.