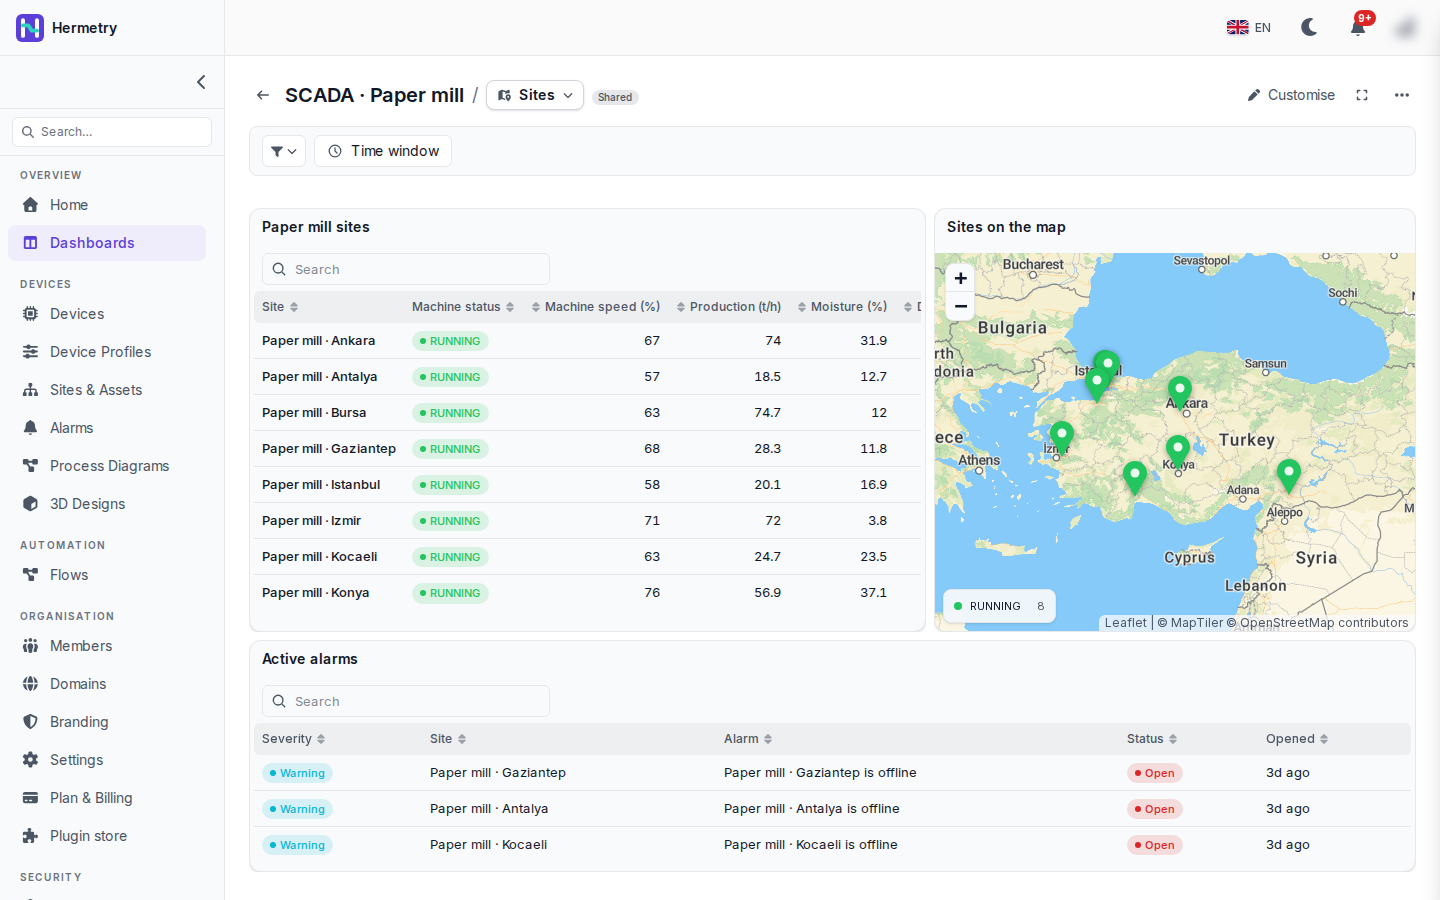
Last one for now, from the demo workspace: the Sites page of a shared “SCADA · Paper mill” board.
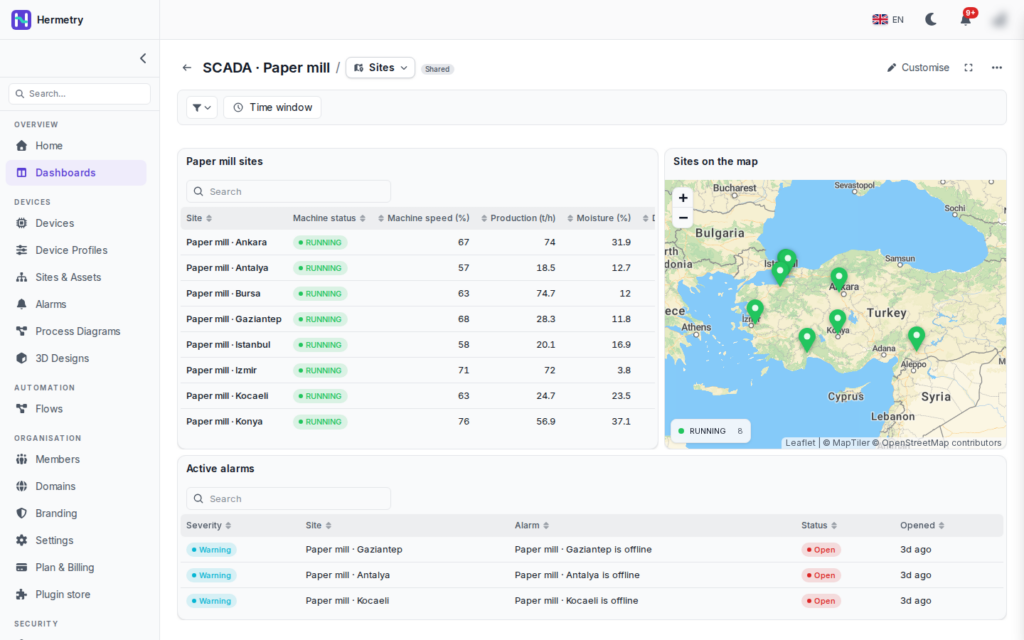
Three cards. The table on the left lists the eight paper mill sites with machine status, machine speed in %, production in t/h and moisture in %, sortable by any column. The map on the right shows the same sites, with a RUNNING 8 legend. Under them, Active alarms lists severity, site, alarm, status and when it opened; three sites have an open “is offline” warning. The toolbar has the filter and the Time window.
It is a demo workspace, so do not read anything into the numbers. The layout is the part I wanted to show: a supervisor sees every site, where it is and what is wrong without opening a second page.