


What the usage card on Automation tells you, protections row included
This is the top of Automation on one of our test workspaces, taken this morning. Most people scroll past the card to get to their flows, so here is what’s on it.
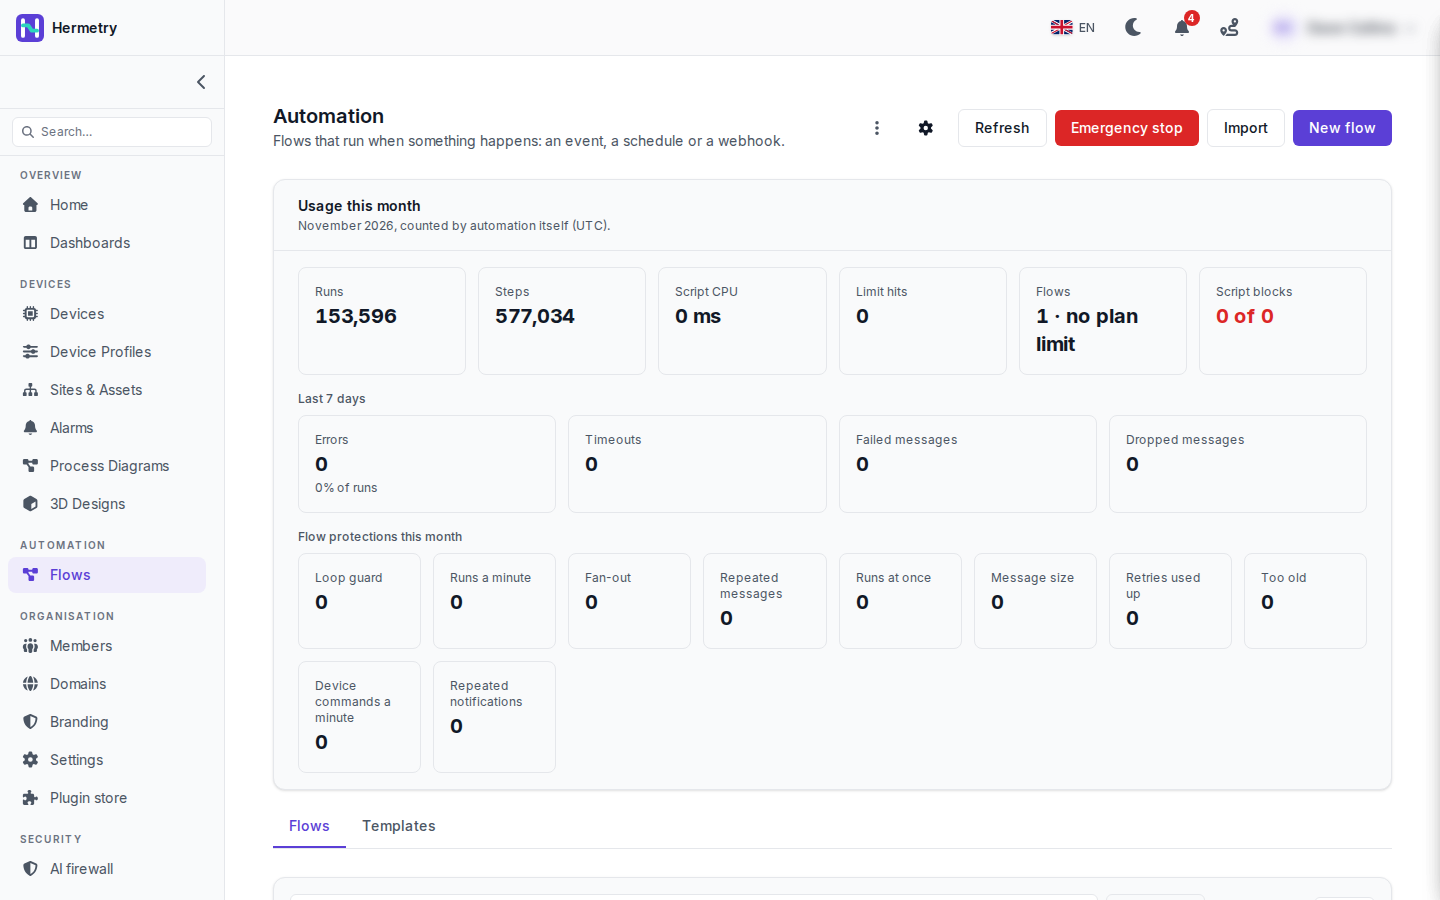
Usage this month is November so far, counted in UTC: 153,596 runs and 577,034 steps, so about 3.8 steps per run. Script CPU is 0 ms and Limit hits 0. Flows says “1 · no plan limit”. Script blocks reads “0 of 0” in red. Flows and Script blocks are the two boxes counted against the plan; script blocks count only in deployed flows.
The Last 7 days row has Errors (with the share of runs, 0 % here), Timeouts, Failed messages and Dropped messages.
The row I’d look at first when a flow behaves oddly is Flow protections this month. Each box counts how often that protection acted: Loop guard, Runs a minute, Fan-out, Repeated messages, Runs at once, Message size, Retries used up, Too old, Device commands a minute and Repeated notifications. All zero here. The defaults behind them are on Protections and failed messages; the ones I get asked about most: a flow pauses itself after 6,000 runs in a minute, at most 16 runs of one flow go at once and the rest wait, flows may send one device 30 commands a minute, and a message may be 256 KiB.
Up in the header there’s Refresh, the red Emergency stop, Import and New flow, and the Flows and Templates tabs under the card.
Is it safe to press Emergency stop once to see what it does? I don’t want our device data to stop being stored.
Don’t try it on a workspace with live devices. It pauses every running flow on every host, root flows included, and the root flow is the one storing your device data. Device messages, schedules and webhooks start no run until you resume.
It does ask first: you tick “I understand that nothing runs until the flows are resumed.” and type STOP. Resume the flows brings back every flow the stop paused. A flow that had paused itself before stays paused. Both are in the audit log.
Why is Script CPU 0 ms with 150k runs? I thought every run used CPU.
Script CPU only counts the CPU time of Script blocks, not the rest of the run. 0 ms means none of this month’s runs spent time in one.
We had Runs a minute trip last month. A Status trigger was watching a block that changed its status on every message, so the flow kept starting itself. It paused, the “Flow paused itself” alert came in, and Activity > Errors made it obvious.
That one again. After the fix: Deploy, then Resume from the flow’s row menu. The pause keeps the flow’s memory and the messages that were waiting.
30 commands a minute per device from flows: we have a flush sequence that toggles a valve every second for two minutes. That would hit it?
Yes. A toggle every second is 60 a minute, over the flows limit of 30 commands and settings a minute to one device (it can be set anywhere from 1 to 600), and the general command limit is 10 per device per minute. Commands over the limit are refused. I wouldn’t drive a one-second sequence from the cloud anyway. Put the sequence in the device firmware and send one command that starts it, with the duration as a parameter.
- You must be logged in to reply to this topic.
Join the conversation
Sign in to ask and answer, like helpful posts and mark the reply that solved your problem. Every contribution earns points and levels.